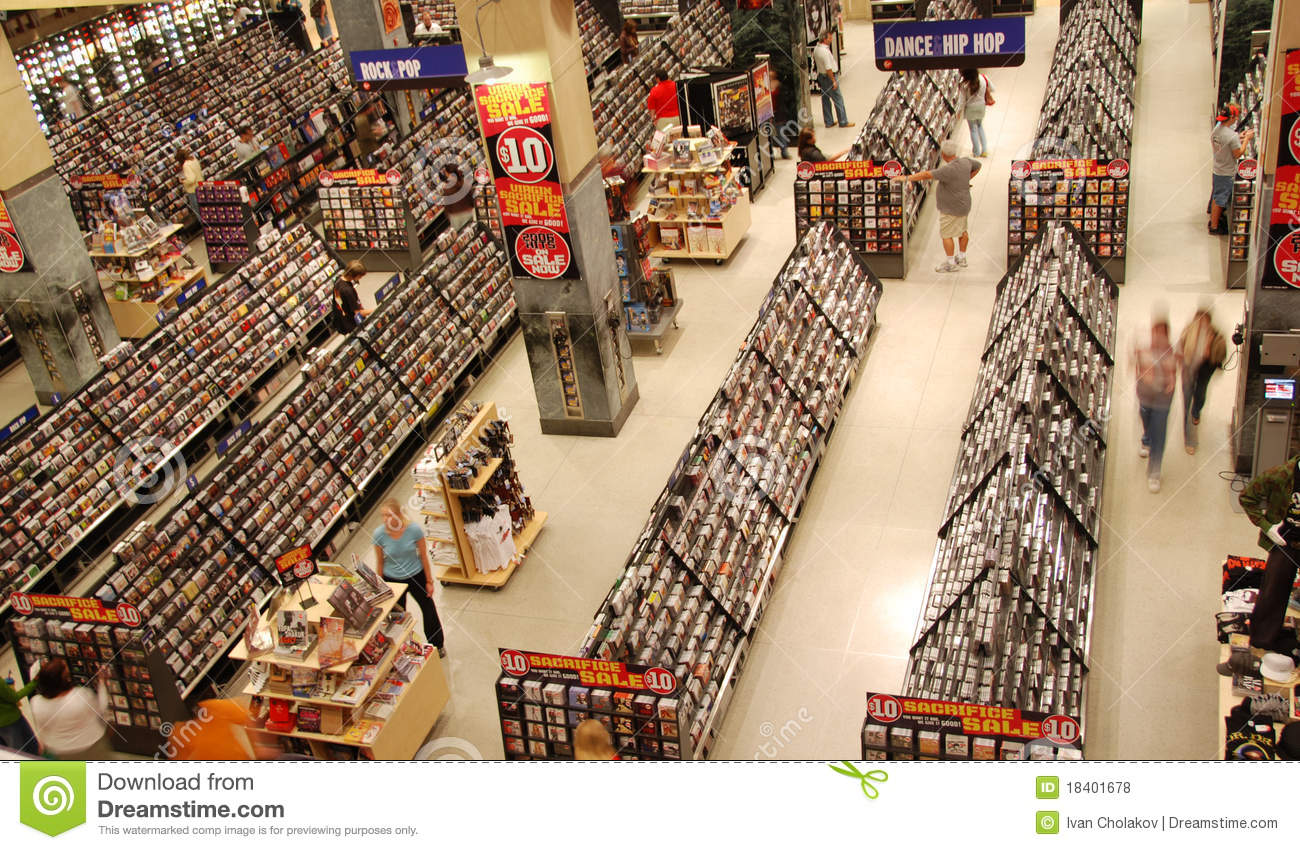
In a world where Companies need to play catch up with the ever changing customer behaviours. There's always the need for them to to detect and understand customer feelings. Companies that use these tools to understand how customers feel can use it to improve CX.In this project, i perform sentiment analysis on IMDP dataset by first carrying EDA, then using nltk package build different models and compare results. After which I used GridSearch for hyparameter tuning and later deployed my model...

This notebook focuses on visualisation & analyses of Superstore Dataset from Kaggle.It contains lots of informations such as the customer ID, city and so on. My analyses is divided to data importation, data cleaning and data visualisation.
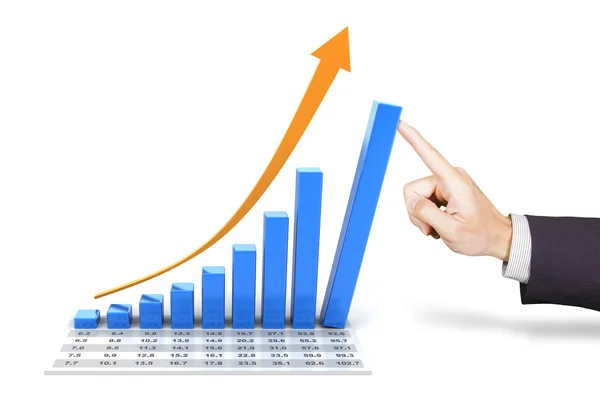
Built and designed detailed and interactive Dashboard to visualise and analyse sales data by identify the revenue drivers, how revenue percentages by product..ect.
Main Users would be shareholders i.e Financial Planning & Analysis Manager, Head of Commercial, Sales Manager.

This project tries to dicepher what a credit score is and how insurance providers determine this using the features from ACME Insurance dataset. Through EDA I was able to identify that smoking, diabetetes etc.. have an underlying effect on the premium payable by ACME insurance customers. I then build a model to predict amount of insurance payable by an individual.

Since Tableau is a powerful Business Intelligence and Data Visualization tool,according to IT research firm, Gartner; I leverage its tools on financial and economic data to identify key trends, customer behaviour, financial analysis, build sales dashboards among other business concepts. I have used measures, map charts,line charts,pie charts, donuts, tree plots..etc

Using Joins, CTE's, Temporary Tables, Windows Functions, Aggregate Functions, Creating Views,and Converting Data Types. I analysed Covid 19 data by Country.Region and Continent.I identified the top countries that were most infected. Lastly, I created new tables using "create view" command...etc

Adventure Works Cycles, an example of an online transaction processing (OLTP) product database by Microsoft . Adventure Works produces and distributes bicycles, parts, and accessories for commercial markets in North America, Europe, and Asia. This project analyzes Internet sales data.
BI analysis was achieved by;
1. CSV files importation
2. data transformation with Power Query
3. Creating relations
4. Building visuals and creating measures